Strymon’s what-if analysis is a powerful tool that enables datacenter operators to solve diagnostic problems, optimize resources, verify invariants, perform capacity planning, and prevent disastrous faults. Through online simulation, Strymon can answer concrete what-if questions such as “how will the network connectivity be affected if switch X fails?” or “what will be the response time of application Y if we migrate it to a new server?”.
Here, we look into such a use-case that studies the effect of alternative load balancing strategies on the network traffic of a real enterprise datacenter. The datacenter consists of thousands of physical machines (many running multiple virtual machines), hosting about 13,000 service instances. Under normal operation, the datacenter as a whole receives a few hundred thousand external user requests per second, which translate into multiple internal RPC calls.
Applications and middleware are instrumented with appropriate functionality to emit log records when messages are sent and/or received by each service or application process. Each request is assigned a unique ID upon its entry into the system and carries this metadata across components. It is common practice to decouple applications and middleware from logging by buffering traces locally on the producer and propagating log records to a set of dedicated servers, known as the logging servers, in the background.
Messages in the datacenter are routed according to the Open Shortest Path First (OSPF) protocol whereas all requests are forwarded to application instances based on a weighted Round Robin (wRR) strategy.
Our goal is to estimate the network link utilization in the datacenter (a task that is also known as traffic matrix construction) under hypothetical scenarios where the network topology and/or the application load balancing strategy change. Changes in network topology reflect unavailability of resources (some links or servers are down) or software updates during which some application instances are temporarily suspended. The what-if analysis has access to the following data inputs:
- The datacenter topology (servers and links).
- The specifications and the placement of the VMs, applications, and middleware instances (extracted from the configuration databases).
- The routing protocol specification, in this case Open Shortest Path First (OSPF).
- The load balancing strategies we want to compare; specifically, the weighted Round-Robin (wRR) that is used in practice, simple Round-Robin (RR), and Least-loaded Replica (LL).
- The logs emitted by the logging servers. Each such logged event includes the source and destination IPs of the communicating components along with the type and size (in bytes) of the exchanged message.
Figure 1 shows a high-level view of a dataflow plan for this particular analysis.
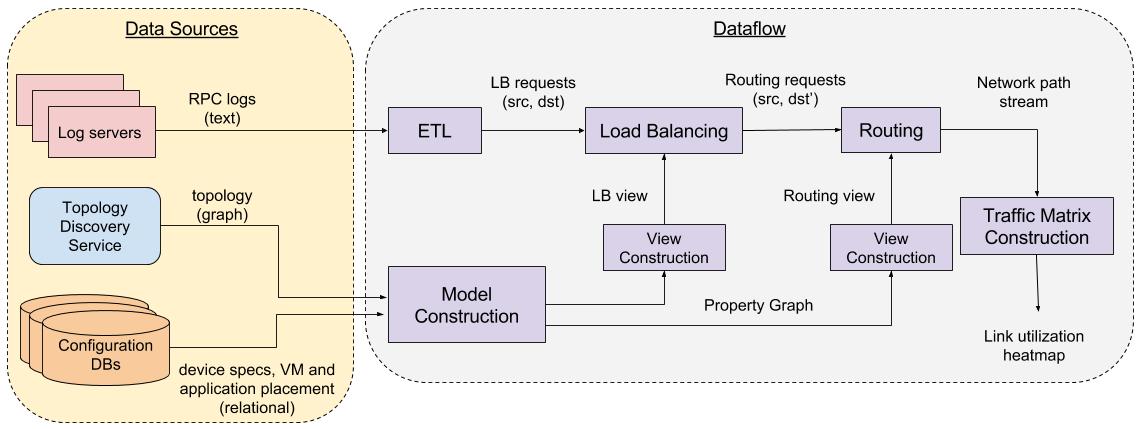
For the purposes of our analysis we consider the following modules, each one implemented as a timely dataflow:
-
Model Construction is instantiates Strymon’s data model with the input data from the external sources.
-
The Extract-Trasform-Load (ETL) module is fuses the incoming datacenter logs with Strymon’s model.
-
The Load Balancing module is implemented as a dataflow that receives a stream of
(src, dst)requests to be load balanced, and outputs a stream of(src, dst')pairs, each corresponding to the destination node as specified by the respective load balancing strategy. -
The Routing module is implemented as an iterative dataflow described here. The routing module ingests a stream of edges that constitute the network topology graph along with a stream of
(src, dst)routing requests, and outputs a stream of paths. -
The Traffic Matrix Construction ingests a stream of paths along with the size of each transmitted message and aggreates the total bytes sent through a path.
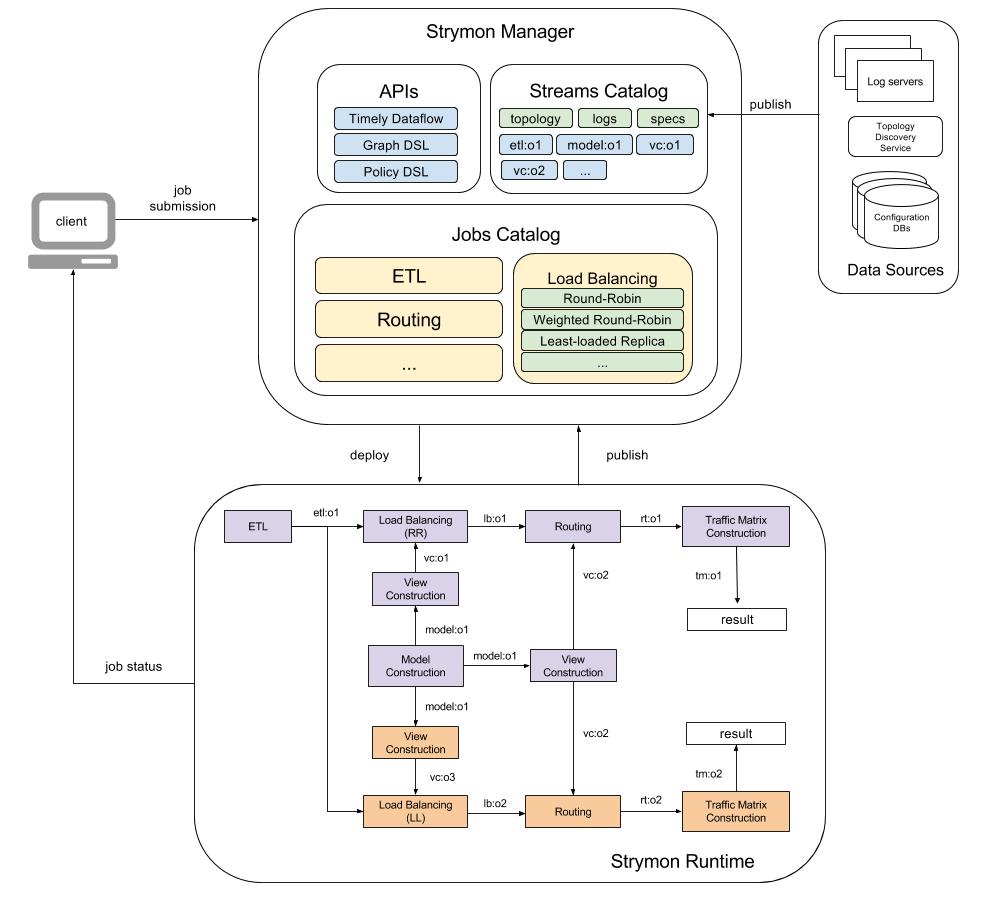
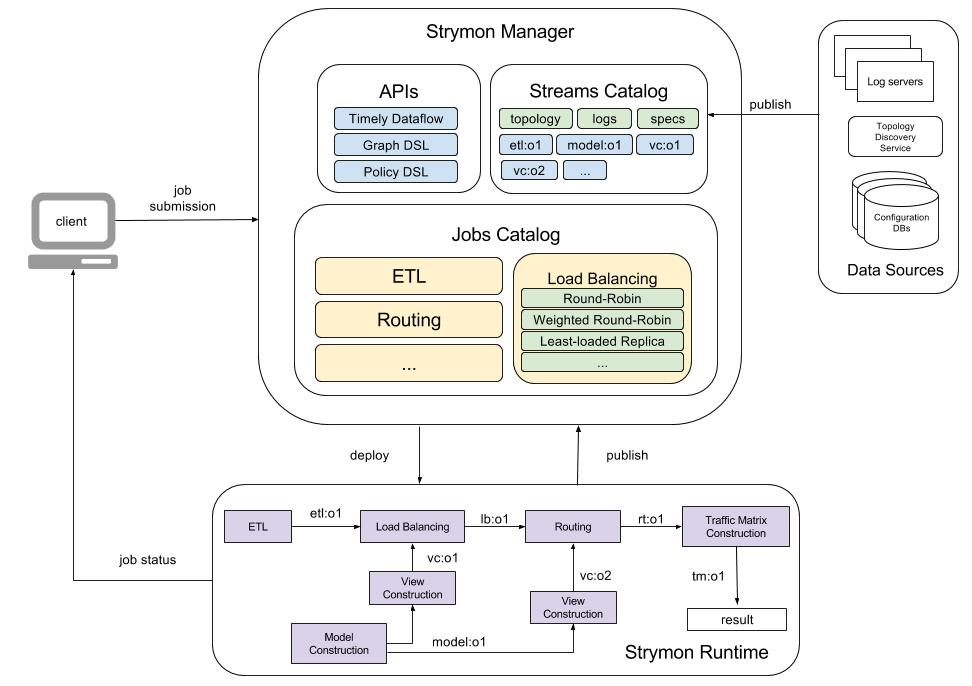
Figure 2 shows a possible deployment of this dataflow in Strymon.
Strymon users interact with the Strymon Manager to inspect the available data streams and dataflows as well as to create and deploy new ones. Note that the list of available streams contains not only the input data streams but also intermediate results of runnning dataflows, which can be forked and reused to avoid unnecessary recomputations.
To simulate the link utilization for the same datacenter workload (logs) under different load balancing strategies, Strymon users can deploy multiple dataflows like the previous by changing the load balancing module. Figure 3 showsh such a scenario for the Least Loaded (LL) load balancing strategy.
Besides different load balancing strategies, arbitrary changes to the network topology can be simulated by simply pushing updates into the Model Construction dataflow as explained here.